Things Have Changed!
About Those Changes ...

The Formulate2 website has been updated. If you would like to learn more about Formulate2 or the Formulate2 Core Components, please use the links
on the lefthand side of this page or, click on the Let's Talk image below.
Predictive Reliability

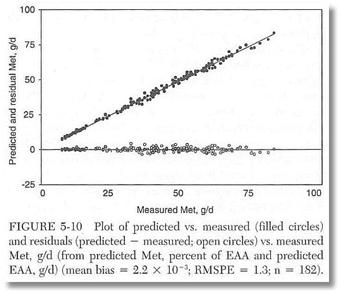
Plots of predicted vs. measured flows of MP-Met from the dataset used to generate the NRC 2001 EAA profile equations. The prediction error across this entire, very diverse dataet of 199 diets was only 1.3 g day. Excellent predictive reliability!
About Those Changes ...
The Formulate2 website has been updated. If you would like to learn more about Formulate2 or the Formulate2 Core Components, please use the links on the lefthand side of this page or, click on the Let's Talk image below.

Predictive Reliability
Plots of predicted vs. measured flows of MP-Met from the dataset used to generate the NRC 2001 EAA profile equations. The prediction error across this entire, very diverse dataet of 199 diets was only 1.3 g day. Excellent predictive reliability!